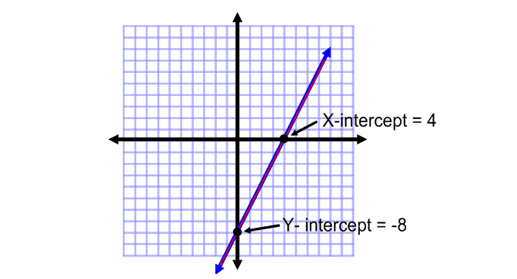
Definition: y-intercept is where a line on a graph crosses over the x-axis
Y-intercept in the real world is where you would start a graph if the equation didn't go below 0. The y-intercept is what you put in the equation y=mx+b.
The graph above has an equation of y=2x-8
Ex: So say you were tracking how fast a baby grew in it's life until it was 5. The age would be the x-axis and the growth would be the y-axis. You can't track how the baby grew before it was born so you would start at 0 on the x-axis and however many inches tall it was when it was born.
The average lifespan of an American Woman started being tracked in 1960. It has been going up every year. The equation to represent this growth is y=0.2x+73.
a.) Put this data into a table going until 1980.
b.) Put the data onto a graph and connect the points.
c.) Find the y-intercept.
Answer Key:
a.)
| 1960 | 1961 | 1962 | 1963 | 1964 | 1965 | 1966 | 1967 | 1968 | 1969 | 1970 | 1971 | 1972 | 1973 | 1974 | 1975 | 1976 | 1977 | 1978 | 1979 | 1980 |
| 73 | 73.2 | 73.4 | 73.6 | 73.8 | 74 | 74.2 | 74.4 | 74.6 | 74.8 | 75 | 75.2 | 75.4 | 75.6 | 75.8 | 76 | 76.2 | 76.4 | 76.6 | 76.8 | 77 |
b.)
c.) The y-intercept is 73 because that is where the graph starts at.

No comments:
Post a Comment