Sunday, May 12, 2013

Unit 5, Day 4:Students will define the y intercept in math as well as translate it to a real world meaning


Definition: y-intercept is where a line on a graph crosses over the x-axis
Y-intercept in the real world is where you would start a graph if the equation didn't go below 0. The y-intercept is what you put in the equation y=mx+b.
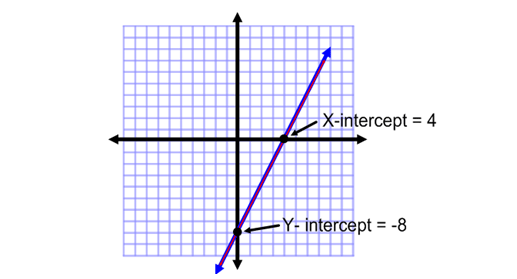
The graph above has an equation of y=2x-8

Ex: So say you were tracking how fast a baby grew in it's life until it was 5. The age would be the x-axis and the growth would be the y-axis. You can't track how the baby grew before it was born so you would start at 0 on the x-axis and however many inches tall it was when it was born.

The average lifespan of an American Woman started being tracked in 1960. It has been going up every year. The equation to represent this growth is y=0.2x+73.
a.) Put this data into a table going until 1980.
b.) Put the data onto a graph and connect the points.
c.) Find the y-intercept.

Answer Key:
a.)
1960 1961 1962 1963 1964 1965 1966 1967 1968 1969 1970 1971 1972 1973 1974 1975 1976 1977 1978 1979 1980
73 73.2 73.4 73.6 73.8 74 74.2 74.4 74.6 74.8 75 75.2 75.4 75.6 75.8 76 76.2 76.4 76.6 76.8 77

b.)
c.) The y-intercept is 73 because that is where the graph starts at.

Friday, May 10, 2013

Unit 5, Day 3: Students will be able to find the number of outcomes for compound events, identify independent and conditional events, and compute probability and odds

Objective: Students will be able to find probability and odds.

Survey Question: Do you like winter?

Survey Results
GenderYesNoTotal
Male152540
Female105060
Total2575100
Sample question: “Find the probability that the answer was no, given that the respondent was male.”
  • Step 1: Find the probability of both the events in the question happening together. In our sample, question, we were asked for the probability of no + male. From the table, that is 25.
  • Step 2: Divide your answer in step 1 by the total figure. In our example, it’s a survey, so we need the total number of respondents (100, from the table).
    25 / 100 = 0.25
  • Step 3: Identify which event happened first (i.e. find the independent variable). In our example, we identified the male subgroup and then we deduced how many answered no, so “total number of males” is the independent event. The question usually gives this information away by telling you “given that the respondents were male…” (as in our question).
  • Step 4: Find the probability of the event in Step 3. In our example, we want the probability of being a male in the survey. There are 40 males in our survey, and 100 people total, so the probability of being a male in the survey is 40 / 100, or .4.
  • Step 5: Divide the figure you found in step 2 by the figure you found in step 4.
  • .25 / .4 = 0.625
Questions:
1.) Use the sample chart to find the probability of females who answered yes.
2.) Find the probability if there was 20 females who answered no.
3.) Find the probability if there was 53 males who answered no.

Answers:
1. Probability for females who answered yes is .4166666
2. Probability for females who answered no is .33333
3. Probability for males who answered no is 1.325


Probability in Real World:


Thursday, May 9, 2013

Unit 5, Day 2. Objective: Students will write the linear equation of a line using data from line of best fit, or given 2 points.

Objective: Write the equation of a line using line of best fit, or given 2 points.


Step 1: Use table or points to graph.


Step 2: Draw line of best fit


Step 3: Determine equation by finding y-intercept and slope.


Y-intercept= 5
Use rise over run= 10/20 = 1/2
plug into equation y=mx+b  (m-slope b- y intercept)
y=1/2x+5


Questions:  
1.) Graph these points and line of best fit. (2,1) (3,3) (5,4) (6,6) (8,9) (11,16) (14,17) (16,19)


2.) Find slope of line.


3.) Write equation of line.


Answer Key:
1.
2. Slope of line= 1

3. Equation of line: y= x+1